Coagulase Negative Staphylococci
Resistance to methicilin
Basic statistics
(January-June 2001)

Coagulase Negative Staphylococci
Resistance to methicilin
Basic statistics
(January-June 2001)
TABLE 1. Clusters of the hospitals based on the
resistant to methicilin
of Coagulase negative staphylococci
|
A. ALL WARDS
|
||
|
Cluster
|
Mean % Resistance ±
SD
|
Hospital
|
|
"Low Resistance"
|
52% ± 7%
|
GR001, GR004, GR005, GR013, GR014, GR015, GR026, GR027,
GR032, GR038, GR040, GR042, GR044, GR046
|
|
"High Resistance"
|
74% ± 6%
|
GR007, GR009, GR012, GR018, GR024, GR028, GR033, GR035,
GR039
|
| B. ICU | ||
|
Cluster
|
Mean % Resistance ±
SD
|
Hospital
|
|
"Low Resistance"
|
57% ± 11%
|
GR015, GR046, GR038, GR027
|
|
"High Resistance"
|
82% ± 7%
|
GR001, GR005, GR007, GR012, GR013, GR014, GR024, GR028,
GR033, GR035, GR039, GR040
|
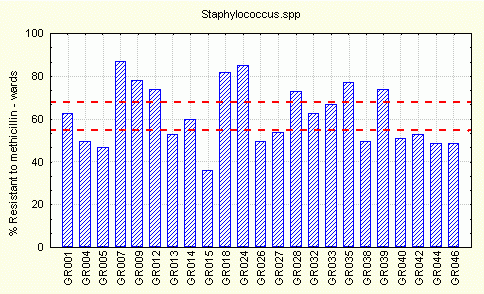
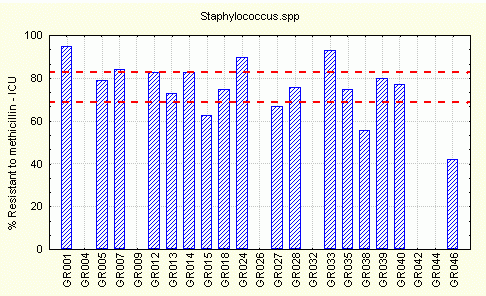
Figure 1. % resistant to methicilin, by hospital wards.
Dot lines represents 95% CI of the overall mean
A. All WARDS

B. ICU

|